
Ever tried telling a joke to a room full of strangers? You might get crickets, a few confused looks, or even accidentally offend someone. In business, communicating without knowing your audience carries the same risk, but the stakes are much higher—think wasted ad spend, content that falls flat, and missed opportunities to connect.
This is where audience analysis comes in. It’s the process of figuring out who your audience is, what they care about, and how they think so you can talk to them in a way that actually resonates. It’s less about guesswork and more about good old-fashioned detective work, swapping assumptions for real, actionable data.
Why You Can't Afford to Skip This Step

At its heart, audience analysis is the art of listening before you speak. It’s about building a clear, three-dimensional picture of the people you’re trying to reach—a picture that goes way beyond basic demographics.
It's No Longer Optional
Years ago, businesses could get away with broad, one-size-fits-all messaging. Not anymore. Today’s consumers are drowning in information and have come to expect personalized experiences. They connect with brands that “get” them and tune out the ones that don’t.
This shift has turned audience analysis from a "nice-to-have" marketing tactic into a fundamental part of doing business. The numbers back this up. The audience analytics market is expected to jump from $5.0 billion in 2024 to a whopping $9.96 billion by 2030. That growth isn't just a trend; it's a direct reflection of companies realizing that deep customer understanding is the key to staying relevant.
Audience analysis isn't just about selling more stuff. It's about building real relationships. When you understand someone's challenges, values, and motivations, you can serve them better, earn their loyalty, and build a brand that lasts.
The Real-World Payoffs
Putting in the time to properly analyze your audience delivers clear, measurable wins. It sharpens almost every part of your business, making your efforts more targeted, efficient, and impactful.
Here’s a quick look at the benefits:
- A Smarter Content Strategy: When you know what your audience is curious or worried about, you can create content they'll actually want to read, watch, or share. This is the bedrock of a powerful content marketing strategy.
- Better Products and Services: Understanding customer pain points is a goldmine for innovation. It helps you build products and features that people genuinely need and are happy to pay for.
- Higher Conversion Rates: Messaging that speaks directly to a person's needs is incredibly persuasive. It makes them far more likely to take that next step, whether that's clicking "buy," signing up, or becoming a fan.
- More Bang for Your Marketing Buck: Targeting the right people with the right message stops you from throwing money at campaigns that miss the mark. Every dollar is spent with purpose.
To give you a clearer picture, let's break down the core components of audience analysis. This table summarizes the key areas you'll want to investigate.
Key Dimensions of Audience Analysis
| Dimension | What It Reveals | Example Question to Answer |
|---|---|---|
| Demographics | The "who" of your audience (age, gender, location). | Are we targeting millennials in urban areas or retirees in the suburbs? |
| Psychographics | The "why" behind their actions (values, interests, lifestyle). | What do they value most: convenience, sustainability, or luxury? |
| Behavioral | The "how" they act (buying habits, brand interactions). | How do they research products before making a purchase? |
| Needs & Pain Points | The problems they need to solve. | What's the biggest challenge they face in their day-to-day work? |
Each of these dimensions offers a different piece of the puzzle. When you put them all together, you get a complete view of the person on the other side of the screen, which is exactly what you need to make a genuine connection.
Understanding the Three Layers of Your Audience

Think of great audience analysis like writing a compelling character for a movie. A flat, one-dimensional sketch won’t cut it. You need to know what drives them, how they think, and what they actually do to make the story resonate. The same goes for connecting with your audience.
To really get who you’re talking to, you have to peel back three distinct layers. Each layer adds a new dimension, taking you from a blurry outline to a sharp, detailed portrait of a real person. This is how you craft messages that don't just get seen—they feel personal.
Layer 1: The Demographics
First up are demographics. This is the foundational "who" of your audience—the hard, statistical data that gives you a basic sketch. It’s the stuff you can easily observe and categorize.
This layer answers questions like:
- Age: Are we talking about Gen Z just starting their careers or Baby Boomers thinking about retirement?
- Location: Do they live in a busy city or a quiet suburb?
- Income Level: What’s their spending power? How does that shape their buying habits?
- Occupation: Are they tech workers, nurses, or entrepreneurs?
Demographics are the easiest data to get your hands on, making them a great starting point. But they only tell you part of the story. They don't explain why people make the choices they do. For that, you need to dig deeper.
While demographics tell you who is buying, they don’t explain the reasons behind it. Knowing your audience is made of 25-35 year old urban professionals is useful, but understanding their values is what turns that data into a real connection.
Layer 2: The Psychographics
If demographics are the black-and-white sketch, psychographics add all the color. This layer gets into the "why" behind your audience’s actions, exploring their values, attitudes, and lifestyle. It’s about understanding their inner world.
Psychographics focus on things like:
- Values and Beliefs: What really matters to them? Are they driven by sustainability, convenience, or status?
- Interests and Hobbies: What do they love to do? Are they weekend hikers, serious foodies, or total tech geeks?
- Lifestyle: How do they live their day-to-day? Are they health-conscious minimalists or comfort-seeking homebodies?
- Personality Traits: Are they adventurous and willing to take risks, or are they careful, analytical planners?
This stuff is gold. It helps you align your brand’s message with what your audience genuinely cares about. Consider that 71% of consumers say they prefer buying from companies that share their personal values. When you get their motivations, you can build a bond that demographics alone could never create.
Layer 3: The Behaviors
The final layer is all about action. Behavioral data shows you what your audience actually does—the "how" and "what" of their interactions. This is where you see your character moving through the world, providing concrete proof of their habits.
Behavioral analysis tracks actions like:
- Purchasing Habits: Are they loyal, frequent buyers, or do they only show up for a good sale?
- Brand Interactions: How do they engage with you online? Are they clicking links, watching your videos, or dropping comments?
- Product Usage: How are they using your product? Are they power users digging into every feature, or are they just sticking to the basics?
- Online Activity: Which social media platforms are they on? What sites do they browse when they’re researching something new?
This final layer connects the dots between who someone is (demographics) and why they do things (psychographics) with what they end up doing. It lets you spot patterns, predict what they might do next, and make your strategy that much sharper. It’s the ultimate reality check.
Your Actionable Guide to Conducting Audience Analysis
So, you understand the what and the why of audience analysis. Now it's time to get practical.
Think of this as your step-by-step playbook for turning abstract data into real, actionable insights. We're moving from theory to execution, giving you a repeatable process to follow. This is where you stop guessing and start building a strategy on a foundation of solid evidence.
Step 1: Define Your Objectives
Before you even think about looking at analytics or sending out a survey, you have to ask one simple question: What do I need to learn?
Without a clear goal, your analysis will be a rudderless ship. You'll end up with a mountain of data but no idea what to do with it. Your objectives are your compass, guiding every decision you make from here on out.
Start by tying your analysis to a specific business goal. Are you trying to:
- Improve Content Engagement? Maybe your objective is to figure out which topics and formats get the most likes, shares, and comments from your audience.
- Increase Conversion Rates? You'll need to dig into the pain points and motivations that actually convince someone to buy.
- Enhance Product Development? The goal here would be to spot unmet needs or common frustrations people have with what’s already out there.
Setting clear objectives ensures you collect the right data to answer your most important questions, saving you a ton of time and effort down the line.
Step 2: Identify Your Data Sources
Okay, you know what you want to learn. The next question is: Where can I find the answers? A huge part of any good audience analysis involves learning how to identify your target audience from the right places. The good news is, data is everywhere. You just need to know where to look.
Generally, your sources fall into two buckets:
- Primary Data: This is the information you gather yourself, straight from the source. Think surveys, one-on-one interviews, customer feedback forms, and focus groups. It’s incredibly valuable because it’s tailored to your exact questions.
- Secondary Data: This is existing information that someone else has already collected. This includes your website analytics (like Google Analytics), social media insights, CRM data, industry reports, and even competitor analysis.
The smartest approach combines both. For example, you could use Google Analytics to see that a lot of people are abandoning a certain webpage (secondary data), then run a quick user survey to understand why they’re leaving (primary data).
This image breaks down the core data types you'll be working with, starting with the basics and moving toward the deeper stuff.
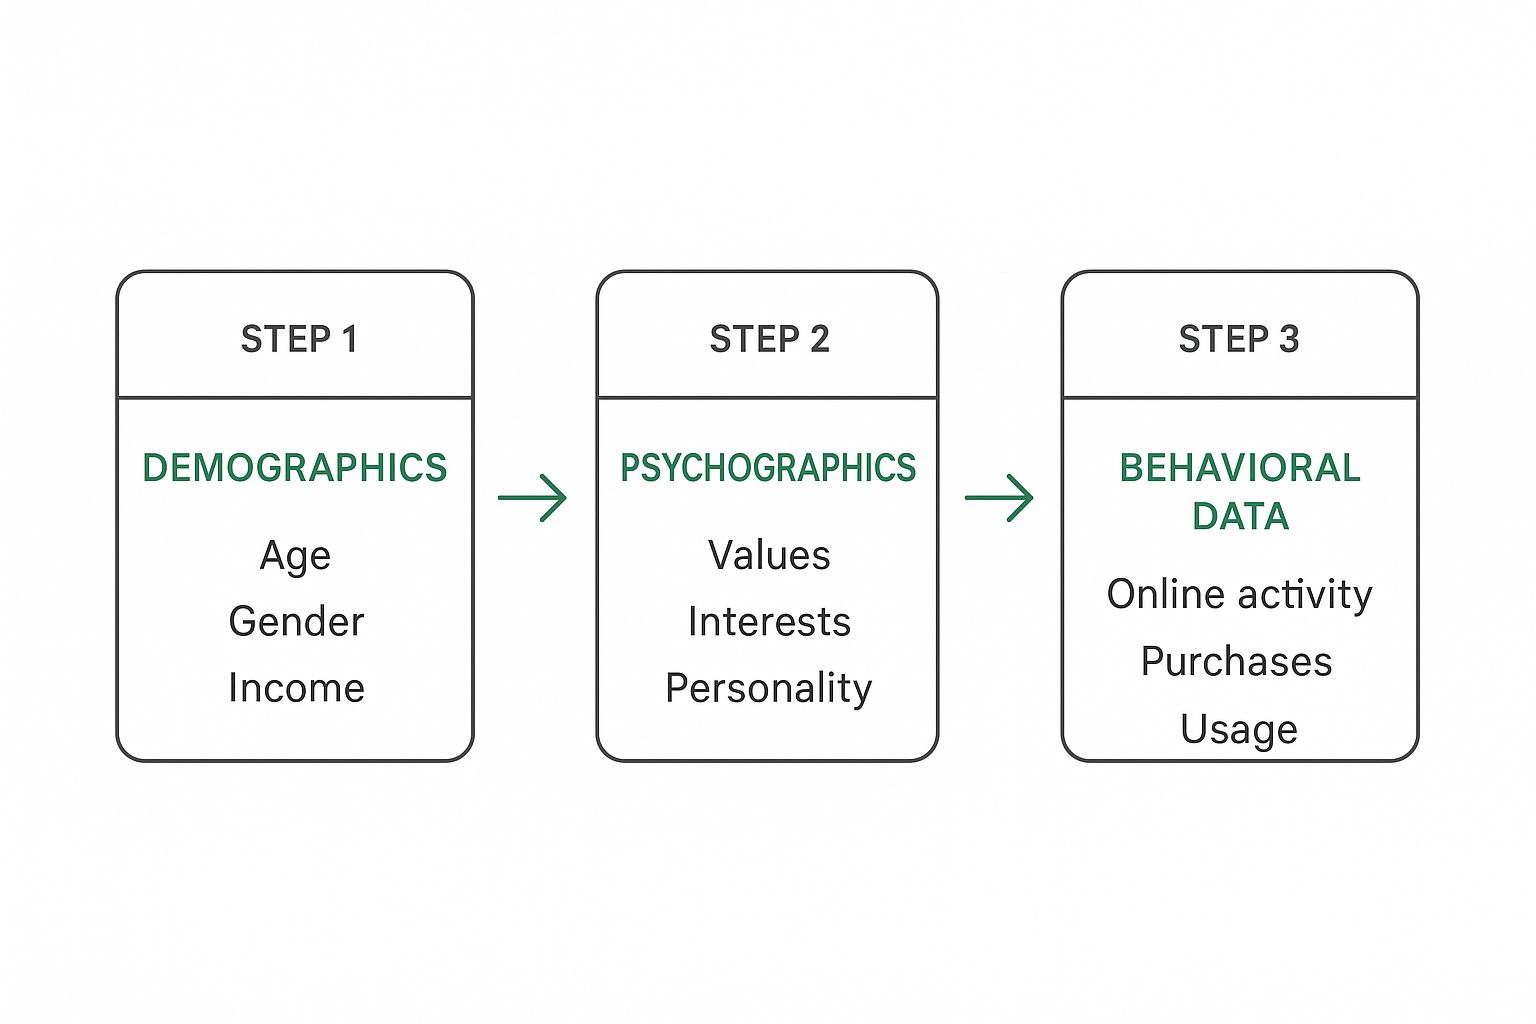
You can see how each layer of data builds on the last, helping you create a much richer, more detailed picture of your audience.
Step 3: Collect the Data
Now it's time to roll up your sleeves and actually gather the information. The methods you pick will depend entirely on your goals and your budget. A B2B software company might conduct in-depth interviews with a few key clients. A B2C e-commerce brand, on the other hand, might lean on large-scale surveys and social media listening.
Just remember that effective data collection is about quality, not just quantity. Make sure your questions are unbiased, your tools are reliable, and you’re always respecting user privacy.
Don't just collect data—collect the right data. A handful of insightful customer interviews can often reveal more than a thousand survey responses with poorly worded questions. Quality consistently trumps quantity.
Step 4: Analyze Your Findings
Once you've got the data, the real detective work begins. This is where you sift through everything you’ve collected to find patterns, trends, and meaningful segments. You're looking for the story the data is trying to tell you.
As you dive in, you should:
- Look for recurring themes in qualitative feedback from interviews or open-ended survey questions. What words or ideas keep popping up?
- Segment your audience based on shared characteristics. You might find one group of price-sensitive shoppers and another that cares more about premium features.
- Connect different data points. Does the behavior you see in your website analytics match what people are saying on social media?
The goal is to turn raw numbers and quotes into clear insights that can actually guide your strategy. Of course, once you've gathered all this intel, you'll need a solid way of measuring content effectiveness to see if your new, audience-focused approach is actually paying off.
Step 5: Create Audience Personas
Finally, it’s time to bring your data to life by creating audience personas.
A persona is basically a semi-fictional character that represents a key segment of your audience. You build it using all the demographic, psychographic, and behavioral data you’ve collected.
A good persona has a name, a photo, a job title, goals, frustrations, and a short bio. For instance, you might create "Marketing Manager Molly," who is 32, tech-savvy, values efficiency, and is constantly struggling to prove ROI to her boss.
Personas are incredibly powerful because they make your audience feel real. They help everyone on your team—from marketers to product developers—empathize with your customers and make decisions with a clear person in mind. Instead of creating for a vague "30-40-year-old professional," you're creating for Molly. That simple shift makes everything you do more personal, more relevant, and ultimately, more successful.
How to Gather Powerful Customer Insights
Once you know what you need to learn, it's time to play detective. Gathering genuinely useful insights isn't about hoarding every scrap of data you can find. It’s about knowing exactly which clues to look for—and where to find them—to build a crystal-clear picture of your audience.
The sources you’ll tap into fall into two big categories: primary research and secondary research. They play different roles, and you'll almost always get the best results by using a mix of both. Think of them as two different lenses. One gives you that close-up, detailed view, while the other provides a wider, more contextual perspective.
Starting with Primary Research
Primary research is all about gathering brand-new information straight from the source: your audience. You're the one creating the questions and running the show, which means every piece of information you collect is tailored to your specific goals. This is your chance to get answers that no one else has.
Common ways to do this include:
- Surveys and Questionnaires: These are fantastic for getting quantitative data from a big group. You can quickly get a read on opinions, preferences, and basic demographics.
- One-on-One Interviews: Perfect for digging into the "why" behind the numbers. A 30-minute chat can uncover motivations and pain points that a multiple-choice survey would never catch.
- Focus Groups: Getting a small group together for a guided discussion is a great way to brainstorm ideas and understand shared attitudes or group dynamics.
- Customer Feedback Forms: Simple, yet so effective. Placing these on your site or sending them after a purchase captures immediate reactions and satisfaction levels.
The biggest win with primary research is its specificity. The data is yours and yours alone, directly addressing the questions you have. The trade-off? It can definitely take more time and money to pull off.
Uncovering Clues with Secondary Research
Secondary research, on the other hand, is about sifting through data that someone else has already collected. This existing information gives you a broader context and can help confirm the patterns you're seeing in your own research. It’s an efficient way to get up to speed on market trends without starting from scratch.
Secondary research is your library of existing knowledge. It provides the broad context and trends that help you understand the world your audience lives in, making your primary research more focused and impactful.
You're probably sitting on a goldmine of secondary data already. Valuable sources include:
- Website Analytics: Tools like Google Analytics are treasure troves. They show you which pages people love, how they found your site in the first place, and where they tend to leave.
- Social Media Analytics: Your platform's built-in insights reveal follower demographics, what content they engage with most, and when they're online.
- CRM Data: Your Customer Relationship Management system is packed with history on past purchases, customer service chats, and sales cycles.
- Industry Reports and Studies: Published market research can give you a high-level view of industry benchmarks, what consumers are buying, and economic trends.
Secondary research is usually faster and cheaper to get your hands on. The only catch is that it wasn't made just for you, so it might not be a perfect fit for your specific questions.
Putting It All Together for a Complete Picture
The real magic happens when you blend these two approaches. For example, your Google Analytics might show that one particular blog post is getting tons of traffic (secondary data). That tells you what is happening. To figure out the why, you could send out a quick survey asking readers what they liked about it (primary data).
This combined method is more powerful than ever, especially with social media generating trillions of data points every single day. A 2023 study found that over 70% of marketers now use social media analytics to shape their targeting. The payoff is huge—campaigns using these insights see engagement rates up to 3 times higher than those sticking to old-school demographics alone.
Ultimately, all this research helps you build a solid, cohesive understanding of your audience. The best way to make sense of it all is by creating detailed buyer personas. Personas turn all that raw data into relatable characters that can guide everything from product development to your next marketing campaign. By turning abstract info into actionable strategy, you can tailor your messaging with real precision. Our guide on what is content personalization offers more tips on how to put these insights to work.
Choosing the Right Audience Analysis Tools
Doing a proper audience analysis takes more than just good instincts. You need the right tools to pull in the data and make sense of it. Think of these tools like a set of specialized lenses—each one brings a different layer of your audience into focus. When you pick the right ones, a complicated task becomes a straightforward, data-driven process.
The right tech stack helps you move from vague ideas to solid insights, automating a lot of the heavy lifting and pointing out patterns you’d probably miss on your own. Let's break down the main categories to help you build out your toolkit.
Web Analytics Platforms
Web analytics tools are your ground zero for understanding what people do on your website. They track how users get to you, which pages they click on, and how long they stick around. This is the bedrock of behavioral analysis, showing you exactly what your audience does.
Google Analytics is the go-to for a reason; it gives you a mountain of information for free. It can tell you about your visitors' demographics like age and location, how they found you, and the path they take through your site.
Here’s a peek at a typical Google Analytics dashboard, which gives you a snapshot of key user metrics.
This kind of dashboard quickly shows you things like new vs. returning visitors and average session duration—both are critical for figuring out if your content is actually hitting the mark.
Social Media Listening Tools
Social media platforms are basically giant, real-time focus groups, and listening tools let you eavesdrop on the conversation. Tools like Brandwatch or Sprout Social help you tap into these discussions to uncover what your audience cares about, talks about, and feels. They keep an eye on mentions of your brand, your competitors, and important industry keywords.
This gives you raw, unfiltered insights into public opinion and what’s trending, helping you understand the "why" behind what your audience is doing.
Survey Platforms
Sometimes, the easiest way to get answers is to just ask. Survey platforms like Typeform or SurveyMonkey make it simple to build and send out questionnaires to get feedback straight from the source. They’re perfect for gathering both hard numbers (like ratings) and qualitative thoughts (like open-ended opinions).
Use surveys to check the assumptions you’ve made from your analytics. If you notice people are leaving a certain page, a quick survey can ask them directly what’s missing. That gives you clarity that numbers alone just can't provide.
CRM Systems
Your Customer Relationship Management (CRM) system, whether it’s HubSpot or Salesforce, is an absolute goldmine of data on your existing customers. It logs every single interaction, from the first time someone contacts you to their purchase history and support tickets.
Digging into this data helps you map out the entire customer journey, figure out who your most valuable customers are, and spot common frustrations. A good CRM gives you the full story on your most loyal fans.
Comparison of Popular Audience Analysis Tools
To help simplify your choice, it’s useful to see how these different tool categories stack up against each other. Each one serves a distinct purpose, and the best strategies often involve using a mix of them to get a complete picture.
| Tool Category | Example Tool | Primary Function | Best For |
|---|---|---|---|
| Web Analytics | Google Analytics | Tracking website user behavior | Understanding what users do on your site |
| Social Listening | Brandwatch | Monitoring online conversations | Uncovering audience interests and sentiment |
| Survey Platforms | Typeform | Collecting direct feedback | Answering specific questions directly |
| CRM Systems | HubSpot | Consolidating customer data | Analyzing existing customer relationships |
By picking and choosing tools from these categories, you can build a truly multi-dimensional view of your audience. This holistic approach ensures your audience analysis rests on a solid foundation of diverse, reliable data, empowering you to make strategic decisions with real confidence.
Audience Analysis in Action: Real-World Examples
Theory is great, but seeing audience analysis in the real world is where it all clicks. Let's move past the concepts and look at how a couple of huge companies turn customer insights into massive wins.
These examples show how a deep understanding of your audience isn't just a marketing task—it's a core business strategy that fuels real growth and loyalty. You'll see a clear line connecting their analysis methods to tangible results, giving you a blueprint for your own approach.
Netflix: The Master of Content Personalization
Netflix is the undisputed king of behavioral audience analysis. They don't just guess what you want to watch next; they use viewing data to decide which multi-million dollar shows to create in the first place.
By tracking what we watch, when we pause, and which genres we binge, Netflix builds incredibly detailed audience profiles.
For instance, they noticed that people who loved the original British House of Cards also tended to watch films starring Kevin Spacey and movies directed by David Fincher. That was a powerful insight. It gave them the confidence to bring all three of those elements together and produce their own blockbuster version of the show. It was a calculated risk, sure, but it was built on a solid foundation of data. And it paid off, big time.
Netflix proves that understanding audience behavior is the ultimate greenlight. Instead of guessing what people want, they analyze what people do, turning data patterns into content that feels tailor-made for viewers.
An E-commerce Brand Cracking the Psychographic Code
Now, think about an e-commerce brand selling sustainable outdoor gear. If they only used demographics, they might target "males aged 25-40 with a high income." That’s a decent start, but it’s way too broad.
A smarter move is to dig into psychographics. Using social listening tools, the brand can pinpoint a key audience segment: people who follow environmental activists, share articles about national parks, and use hashtags like #LeaveNoTrace. This isn't about age; it’s about a shared value system.
Armed with this insight, their ad campaigns don't just show a jacket—they show a lifestyle. Their ads feature real hikers cleaning up trails, and the copy speaks to a shared passion for conservation. This psychographic approach forges a much deeper, more authentic connection. The result? Higher engagement and a fiercely loyal customer base that sees the brand as one of their own.
The rise of digital media has turned this kind of deep analysis into a massive industry. Streaming giants report that over 75% of viewer activity is now shaped by algorithm-driven suggestions, leading to a 20% increase in average watch time per user since 2020. You can learn more about this growing market and see just how big it's become.
Got Questions About Audience Analysis? We've Got Answers.
Even with a solid plan, a few questions always pop up when you start digging into audience analysis for real. Let's tackle some of the most common ones so you can move forward with confidence.
How Often Should I Be Doing This?
Think of audience analysis less like a one-and-done project and more like tuning a guitar. You can't just do it once and expect it to stay in key forever. Markets change, trends come and go, and your customers' needs evolve.
A good rhythm is to do one deep-dive analysis every year and then lighter check-ins each quarter. Those quarterly reviews are perfect for looking at recent campaign data, social media chatter, and customer feedback to make sure you’re not falling out of sync.
What’s the Difference Between Audience Analysis and Market Research?
This one trips a lot of people up. They're related, but they're not the same thing.
- Market Research is the big picture. It's about scoping out the entire industry—your competitors, the market size, pricing trends. It answers the question, “What’s the lay of the land?”
- Audience Analysis zooms in. It's a close-up on a specific group of people—your people—to understand what makes them tick. It answers the question, “Who, exactly, are we talking to?”
Here's a simple way to think about it: Market research helps you find the right pond to fish in. Audience analysis helps you pick the right bait. You really do need both.
Can I Do This on a Shoestring Budget?
Absolutely. You don't need a massive budget to get powerful insights. Some of the best tools out there are free or very affordable.
You can get a ton of info from Google Analytics just by looking at how people behave on your site. Social media platforms have their own built-in analytics that are surprisingly deep. And for direct feedback, you can whip up a quick survey using a free tool like Google Forms.
What About the Ethics of Collecting Data?
This is a big one. Trust is everything.
Always be upfront about what data you’re collecting and why you need it. Make sure you anonymize personal information wherever you can, and stay on the right side of privacy laws like GDPR. Good ethics isn't just about following the rules—it's how you build a relationship with your audience that actually lasts.
Ready to make sure your content speaks to your audience in a natural, human voice? Natural Write transforms AI-generated text into writing that connects. Try our free humanizer and AI detector today at https://naturalwrite.com.