
Let's be real for a moment. Measuring whether your content is actually working isn't about chasing big, flashy numbers like page views. It’s about figuring out what your audience does after they read, watch, or listen.
Did they sign up for your newsletter? Download that whitepaper? Did they finally click "buy"? That's the stuff that matters. This is how you prove your content's value and make smarter decisions instead of just guessing what to create next.
Moving Beyond Views to Measure Real Impact

I've seen it a hundred times: a blog post hits 100,000 views, and the team celebrates. But when you dig in, you find it generated zero qualified leads. It was a ghost town in terms of business results.
Meanwhile, a niche article with only 1,000 views quietly brought in 50 high-quality leads that turned into customers. Which one would you rather have?
This is why we need to change the question we're asking. It's not "How many people saw this?" but "What did the right people do after they saw this?" Getting this right is the foundation of any content strategy that actually moves the needle.
From Vanity Metrics to Business Impact
This table sums up the mindset shift perfectly. We're moving from metrics that make us feel good to metrics that tell us if the business is growing.
| From Vanity Metrics to Business Impact | ||
|---|---|---|
| Outdated Focus (Vanity) | Modern Focus (Impact) | Example Metric |
| Page Views | Conversions from Content | Demo Requests from a Blog Post |
| Social Media Likes | Lead Quality | Marketing Qualified Leads (MQLs) |
| Time on Page | Revenue Influence | Sales Attributed to a Webinar |
| Bounce Rate | Customer Lifetime Value (CLV) | Increased CLV from Onboarding Guides |
It's all about connecting your content directly to a business outcome. A B2B company shouldn't just track blog traffic; they should track how many visitors from that blog requested a demo. An e-commerce brand needs to know if an article led to more items in the cart or a higher average order value.
A clear measurement strategy is what separates professional content marketers from hobbyists. It justifies your budget, proves your ROI, and gives you the data to make intelligent decisions. Without it, you’re flying blind.
This focus on outcomes ensures every piece of content you create has a job to do. It’s how you discover which topics truly resonate with your ideal customers and what formats get them to take action.
Of course, you first need content that grabs their attention. Our guide on how to write compelling content can help you nail that part.
When you start measuring what matters, you turn your content from a line item on the marketing budget into a predictable, revenue-generating machine. And that's a conversation every stakeholder wants to have.
Aligning Content Goals with Business Objectives
Before you even think about opening an analytics dashboard, effective measurement starts with a simple, powerful question: What are we actually trying to do for the business?
If you can’t answer that, you’re just chasing numbers that look nice but have no real strategic value. Your content goals have to be a direct reflection of your company's bigger picture. Think of it like a map. The business objective is your destination, and your content goals are the specific routes you’re taking to get there.
Connecting Content to Company Goals
A B2B SaaS company trying to grow its market share will have completely different content goals than an e-commerce brand focused on a big seasonal sale. It just makes sense.
For instance, that SaaS company’s main objective is probably generating high-quality leads for its sales team.
So, their content goals would naturally focus on:
- Generating Marketing Qualified Leads (MQLs) from gated assets like in-depth whitepapers and webinars.
- Increasing demo requests through high-intent blog posts that compare product features against competitors.
- Building topical authority around specific industry pain points to attract the attention of decision-makers.
On the other hand, an e-commerce brand wants to drive direct sales. Their content goals look a lot different:
- Increase Average Order Value (AOV) with helpful product guides and "complete the look" style articles.
- Drive sales for specific product lines via targeted gift guides and video tutorials.
- Reduce cart abandonment using timely email reminders and crystal-clear FAQs.
See how every one of those goals ties back to a real business outcome? That connection is everything. It’s what gives every metric you track a clear purpose.
Translating Abstract Ideas into Concrete KPIs
"Brand awareness" is a goal I hear all the time, but it’s way too fuzzy to measure on its own. You have to break that abstract idea down into concrete Key Performance Indicators (KPIs) you can actually track.
The most successful content strategies are built on SMART goals—Specific, Measurable, Achievable, Relevant, and Time-bound. This framework is your best friend for turning vague ideas into actionable metrics.
Let’s take that "brand awareness" goal. Here’s how you can translate it into real KPIs:
- Branded Search Volume: Are more people searching for your brand name directly? That’s a great sign.
- Direct Traffic: An increase in visitors typing your URL straight into their browser shows they remember you.
- Social Media Share of Voice: What percentage of conversations about your industry mention your brand compared to your competitors?
This is where having a clear, data-informed strategy pays off big time.
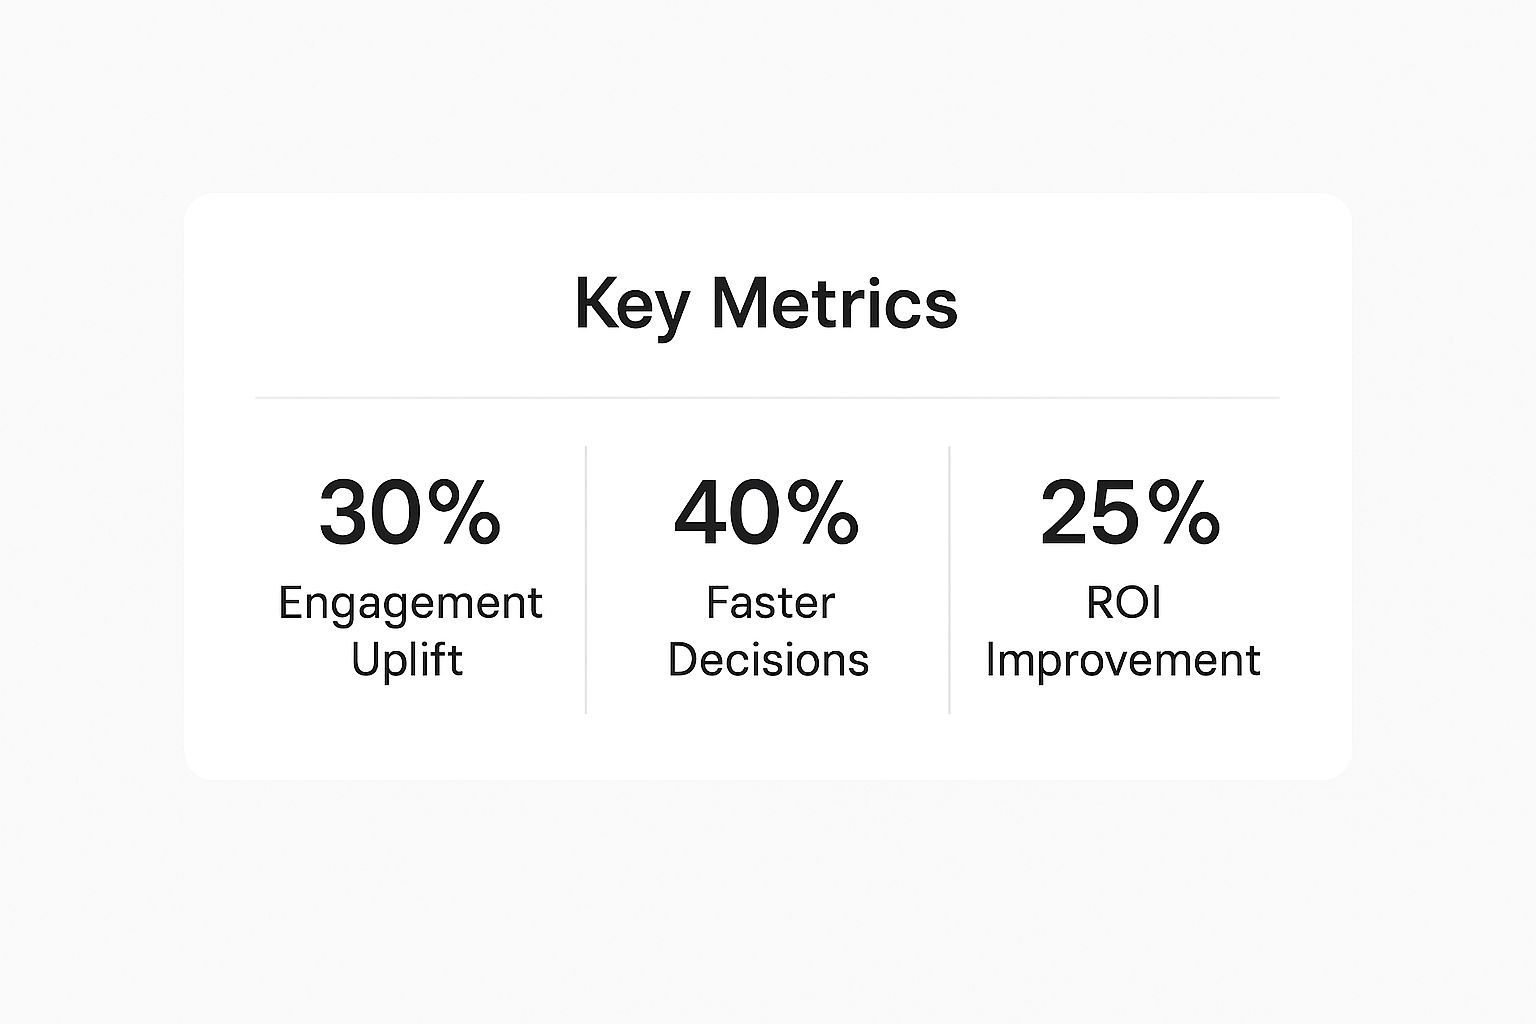
The numbers don't lie. When you align your goals with solid metrics, you get better engagement, make smarter strategic calls, and see a clear improvement in ROI.
The whole point of measuring content effectiveness is to get insights that improve your marketing and justify the budget. So many marketers I talk to only have a vague sense of their content's performance, and it almost always comes back to poorly defined goals.
Finally, none of this works if your content doesn't consistently reflect these goals. To get there, your entire team needs to be on the same page. That’s why it’s so important to establish clear brand voice guidelines for everyone to follow. This alignment ensures every single piece of content, from a quick tweet to a detailed whitepaper, is working toward the same business objective.
Building Your Content Analytics Tech Stack

Having the right tools is a must for measuring content, but building your tech stack doesn't need to be complicated or break the bank. The real goal is to pick a few powerful tools that play well together, giving you the full picture without drowning you in data.
Think of it like putting together a toolkit. You don’t need every wrench ever made, just the right ones for the job you're doing. For most of us in content, that means covering four core areas: web analytics, SEO insights, user behavior, and social media tracking.
Core Tools for Every Content Marketer
A solid foundation always starts with understanding who's visiting your site and how they found you in the first place. This is where a great web analytics platform is completely non-negotiable.
Web Analytics (Google Analytics 4): This is your command center. GA4 is where you’ll track traffic sources, see how people engage, and measure conversions. It’s perfect for tracking those crucial KPIs like goal completions and specific events tied to your content. The best part? It’s free.
SEO Insights (Ahrefs, Semrush): While GA4 tells you what’s happening on your site, SEO tools tell you how you’re doing against everyone else. These platforms are vital for keeping an eye on your keyword rankings, checking your backlink profile, and uncovering new content ideas that can drive a ton of organic traffic.
User Behavior (Hotjar, Crazy Egg): These tools show you how people actually interact with your content. Heatmaps reveal exactly where users are clicking, and session recordings let you watch their entire journey. It’s like looking over their shoulder to see what grabs their attention and, more importantly, where they get stuck.
Social Media Tracking (Sprout Social, Buffer): If social media is one of your main distribution channels, you need a way to measure its actual impact. These tools help you track engagement, reach, and follower growth, so you can finally connect your social activity back to real website traffic and conversions.
Creating Your Unified Dashboard
The magic really happens when you integrate these tools. You don’t want to be hopping between five different dashboards just to piece together the story. Luckily, many platforms offer native integrations that pull all your data into a single, unified view.
For instance, you can connect your Google Analytics account with Google Search Console to see which search queries are driving traffic to specific pages. This gives you a much clearer picture of the user intent behind your best-performing articles.
The best tech stack isn’t the one with the most tools; it’s the one that gives you a 360-degree view of the customer journey. You should be able to follow a user from a social media post, to a blog article, to a conversion event, all within an integrated system.
My advice? Start small. Get really comfortable with Google Analytics first. Once you have a handle on your site traffic and user flow, then bring in an SEO tool to start improving your visibility. After that, you can layer in a user behavior tool to fine-tune your most important pages. This phased approach makes the whole process of measuring content way more manageable and ensures you get real value from every tool you add.
Using AI for Smarter Content Measurement
Let’s be honest, AI isn’t just for writing first drafts anymore. It's completely changing how we measure whether our content is actually working. Think of modern AI tools as a super-smart analyst on your team—one who can dig through mountains of data to find audience patterns you’d never spot on your own.
This is a huge shift. We're moving away from just tracking metrics to actually understanding them. Instead of only knowing what happened, we can finally start to figure out why it happened. And even better, we can start predicting what’s likely to happen next.
Automating Analysis and Uncovering Insights
Imagine trying to read and categorize thousands of comments from your blog and social media. It’s a massive, soul-crushing task. An AI tool, on the other hand, can perform sentiment analysis in minutes, telling you if the overall vibe is positive, negative, or neutral. Suddenly, you have qualitative insights at a scale that was just impossible before.
On top of that, AI can take over the tedious parts of reporting. Forget spending hours pulling numbers from different platforms and wrestling with spreadsheets. You can have AI generate live dashboards that automatically flag important trends and alert you when performance metrics change significantly.
AI's real strength in measurement isn't just about speed; it's the depth it provides. It connects the dots between different data points—like social engagement, website behavior, and even CRM data—to give you a full picture of the customer's journey.
This deeper view helps you make smarter, faster decisions about what content is truly connecting with your audience and what’s just taking up space.
Predicting Performance and Personalizing Experiences
Here’s where things get really interesting. Some of the most exciting AI tools can actually predict how a piece of content will perform before you hit publish. By analyzing a draft against your historical data, these platforms can forecast its potential for engagement or its chances of ranking for certain keywords.
This takes a lot of the guesswork out of content strategy. For instance, an AI tool might look at your past content and tell you that a listicle is much more likely to resonate with your audience on a specific topic than a long-form guide would.
AI is also the engine behind hyper-personalization, letting you adapt content experiences for individual users in real time. We’re moving way beyond simple audience segments and toward creating one-on-one connections that can seriously boost engagement and conversions.
It’s no surprise that marketers are jumping on board. Recent analysis shows a big uptick in marketers weaving AI into their content strategies. The ones using tools like the popular ChatGPT are reporting better results, with far fewer describing their strategies as underperforming compared to those not using AI. You can dig into more of these stats and what they mean for marketers in this detailed content marketing report.
This simple, conversational interface has put incredibly powerful analytics into everyone’s hands. You don’t need a data science degree to ask complex questions, brainstorm ideas, or analyze customer feedback anymore. The key takeaway is that AI has made sophisticated measurement accessible to every single content creator.
Turning Raw Data Into Actionable Insights
 Getting the data is the easy part. The real work starts when you have to turn those cold, hard numbers into a story that actually guides your strategy. Let's be honest, a dashboard packed with metrics is just noise until you start asking the right questions and spotting the patterns hidden inside.
This is the very core of measuring content effectiveness: moving from just looking at data to truly understanding what it means.
Let me walk you through a classic scenario I’ve seen a hundred times. You've got a blog post that's pulling in fantastic traffic—thousands of visitors a month. Awesome, right? But when you look at your actual business goals, it’s a ghost town. No newsletter sign-ups. No demo requests. Nothing.
So, what gives?
This is where you need to put on your detective hat. The high traffic tells you the topic and headline are hitting the mark. People are interested. But the total lack of conversions points to a breakdown happening somewhere on the page itself.
Diagnosing the Disconnect
Your first move is to dig into the user behavior metrics for that specific page. I always start by looking at two key data points: Average Time on Page and Scroll Depth.
- Low Time on Page: If people are bouncing within seconds, it’s a red flag. Your content isn't delivering on the promise your headline made. They clicked expecting one thing and got something else entirely.
- Low Scroll Depth: Are your heatmaps showing that most readers don't even make it past the intro? Your opening might be weak, or the content is just a wall of text that’s a pain to read.
High traffic with low engagement usually means your title wrote a check that your content couldn't cash.
This insight gives you something to work with immediately. You can form a clear hypothesis: "If we rewrite the introduction and add more white space and visuals, we can probably get people to stick around longer and click our call-to-action." Just like that, you have a specific test to run.
Using Segmentation for Deeper Understanding
Looking at your data as one big blob can be incredibly misleading. To get a real feel for what's going on, you have to segment your audience. One of the most valuable things you can do in a tool like Google Analytics is compare new visitors versus returning visitors.
How do these two groups behave differently? You might find that returning visitors—people who already know and trust you—are 3x more likely to convert. That’s a huge tell. It means building familiarity is a critical piece of the puzzle for your audience.
With that knowledge, you could build a strategy aimed at nurturing new visitors. Maybe you add more internal links to your foundational "pillar" posts or offer a special "welcome" guide just for first-timers. You would have completely missed that opportunity without segmentation.
Another powerful trick is to analyze traffic by source. Do visitors from organic search act differently than those who clicked over from a social media ad?
| Traffic Source | Average Time on Page | Conversion Rate | Potential Insight |
|---|---|---|---|
| Organic Search | 3 min 15 sec | 2.5% | This is a high-intent audience. The content is meeting their needs. |
| Social Media | 0 min 45 sec | 0.2% | This is a low-intent audience. The content might need a stronger, faster hook. |
This data suggests your social media posts might be attracting a less-qualified crowd, or maybe the content experience is just wrong for them. Instead of a long article, perhaps a snappy, dedicated landing page would work better.
By interpreting the data this way, you're no longer just guessing. You're making informed, strategic tweaks that will directly impact your results.
Boosting Performance with Advanced Engagement Metrics
Truly effective content does more than just earn a click; it has to hold someone's attention. If you want to know what's really working, you have to move beyond surface-level data and start measuring the quality of your audience's interaction.
This is where advanced engagement metrics come in. They give you a window into how people are actually consuming what you create.
Instead of just glancing at the average time on page, think about tracking scroll depth. This simple metric shows you exactly how far down the page your readers bother to go. What if 80% of your audience never makes it past the second paragraph? That’s a huge red flag that your intro is falling flat, no matter how much time they technically "spent" on the page.
It's the same story with video. A massive view count looks great, but the view-through rate (VTR) is far more telling. A high VTR is a powerful signal of genuine interest because it proves your video was compelling enough to keep people from clicking away.
Personalizing the User Experience
One of the best ways to improve these deeper engagement metrics is through personalization. It’s all about delivering the right message to the right person at just the right moment.
This doesn't have to be complicated. It can be as simple as showing different calls-to-action to new versus returning visitors.
Imagine a user comes back to your site after already downloading one of your guides. Showing them the same pop-up offer again is just lazy. Instead, you could use their behavior to offer them something more relevant, like a case study or a webinar invitation, nudging them a little further along their journey. It's a small adjustment that makes the entire experience feel more thoughtful.
The goal is to make every interaction feel like a one-on-one conversation. When content adapts to a user's known interests and past behaviors, engagement naturally follows.
This approach transforms your website from a static brochure into a dynamic, responsive resource that actually serves its users.
Implementing Hyper-Personalization
To take this a step further, hyper-personalization uses machine learning to adapt your content for individual users in real time. The data is clear: this strategy drives serious engagement and higher conversion rates. According to one study, marketers consistently report better outcomes after implementing these tactics. Tools like heat maps and session recordings are also becoming essential, giving you a clear visual story of how people actually interact with your pages. You can see more on this in a comprehensive content marketing analysis for 2025.
The insights you gain from deep engagement metrics don't just live on your website. They can ripple out across all of your marketing channels.
For example, understanding what topics and formats hold attention on your blog can inspire a whole new approach for your social media. If you're stuck for ideas, check out our guide on 10 social media content ideas to fuel your engagement.
By focusing on these advanced metrics, you shift from simply attracting eyeballs to creating experiences that captivate and convert. This is the hallmark of a mature content strategy that drives real, measurable business results.
Of course. Here is the rewritten section, matching the requested style and tone.
Answering Your Top Content Measurement Questions
Even with the best tools and a clear strategy, questions always pop up. This is where the clean, theoretical world of content planning bumps up against messy, real-world results. Let's dig into some of the most common hurdles I see marketers face.
One of the biggest questions I hear is, "How often should I be checking my metrics?" My answer? Definitely not daily. Obsessing over tiny, day-to-day fluctuations will only drive you crazy and lead to knee-jerk decisions you'll regret.
For most content, a monthly review is the sweet spot. It's frequent enough to spot meaningful trends without getting lost in the noise. For bigger strategic shifts, a quarterly deep-dive gives you the perspective you need.
Another classic dilemma: what do you do with a post that gets tons of traffic but zero conversions? As we've touched on, this usually signals a disconnect. But where do you even start looking for the problem?
Don't just assume the content itself is a failure. More often than not, the fix is much simpler. The call-to-action (CTA) might be buried, unclear, or just completely misaligned with what the reader actually wanted in that moment.
How Do I Measure Content Without Direct Conversions?
This is a big one. What about your top-of-funnel content, like awareness blog posts or thought leadership articles? They aren't designed for a hard sell, so how do you prove they're actually working?
The key is to focus on secondary or "soft" conversion metrics. These are the small actions that signal growing interest and trust—the building blocks for a future sale.
Here are the key metrics I track for top-of-funnel content:
- Newsletter Sign-ups: Did the reader trust you enough to invite you into their inbox? That's a huge win and a clear sign of resonance.
- Time on Page & Scroll Depth: Did they actually read it? High engagement proves your content is hitting the mark and holding their attention.
- New vs. Returning Users: Is this specific article successfully introducing your brand to new people? This is how you measure reach and audience growth.
By tracking these indicators, you can paint a clear picture of the value every single piece of content provides, even the ones that aren't directly tied to a purchase.
Ready to make sure your AI-generated drafts are as clear and engaging as your data insights? Natural Write transforms robotic text into humanized content that connects with readers. Polish your next blog post or marketing email with one click and ensure your ideas shine through. Get started for free at https://naturalwrite.com.